SEO dashboards AI tools are becoming essential as search moves into an answer-first world. If you want to understand how your brand appears inside these new AI experiences, you need a dashboard built for it.
The search world looks different today. If you’ve opened Google recently, you’ve probably noticed how often an AI-generated answer pops up before any of the classic blue links. It feels a little strange at first, almost like the ground is shifting under the feet of traditional SEO.
ChatGPT introduced a Search feature that blends live information with conversational responses. Perplexity climbed past 10 million monthly active users by the end of 2024 and processed more than 500 million queries, as reported by Business Insider. Everywhere you look, the idea of “search” is expanding into something far more dynamic than we’ve been used to.
So where does that leave SEO teams today? In a place that demands new tools and sharper awareness. SEO dashboards were once built around a predictable mix of rankings, impressions, and clicks. Those still matter, of course, but they don’t tell the full story anymore. Not when AI summaries, conversational reply boxes, and instant answers have started shaping what people see first.
That’s why SEO dashboards need to evolve. They must account for AI-led visibility, response inclusion, content citations, and how often a brand appears inside these new AI answer layers. Tracking this is still new, a bit messy, and constantly changing. But it’s essential. Because if AI is deciding what answers people read, then understanding where your brand stands inside those answers becomes part of the core SEO playbook. Let us understand how to build SEO Dashboards that track AI performance.
AI Search Experiences and Why Traditional Metrics Fall Short
AI search results may look familiar, but the experience underneath is very different from the organic SERPs we’re used to. Instead of a simple list of blue links, you now see conversational responses, short snapshots, and dynamic answers that shift as the AI pulls new pieces of information.
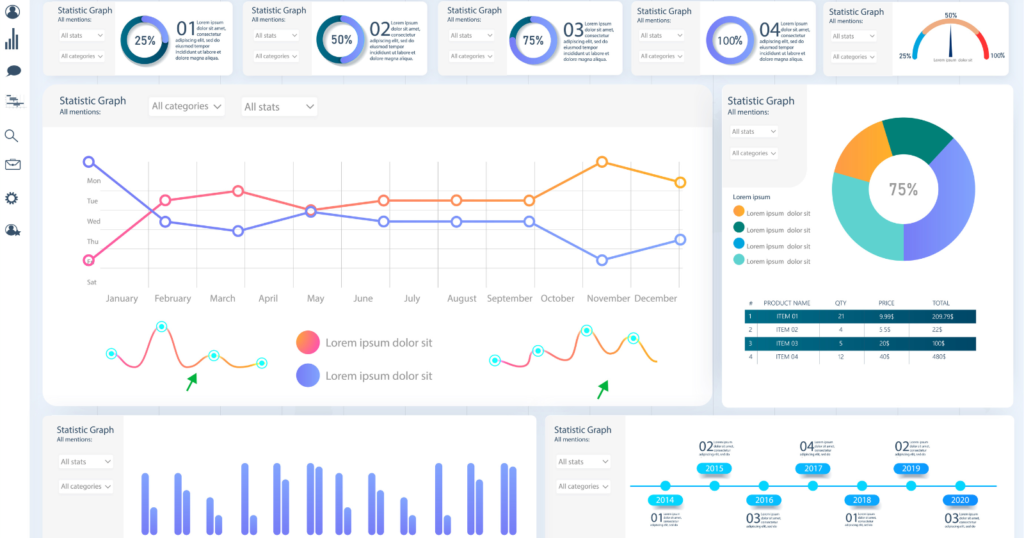
Google’s SGE-style snapshots draw from multiple URLs at once, blending insights into a single response instead of presenting sources one by one. Here is the image to understand better:
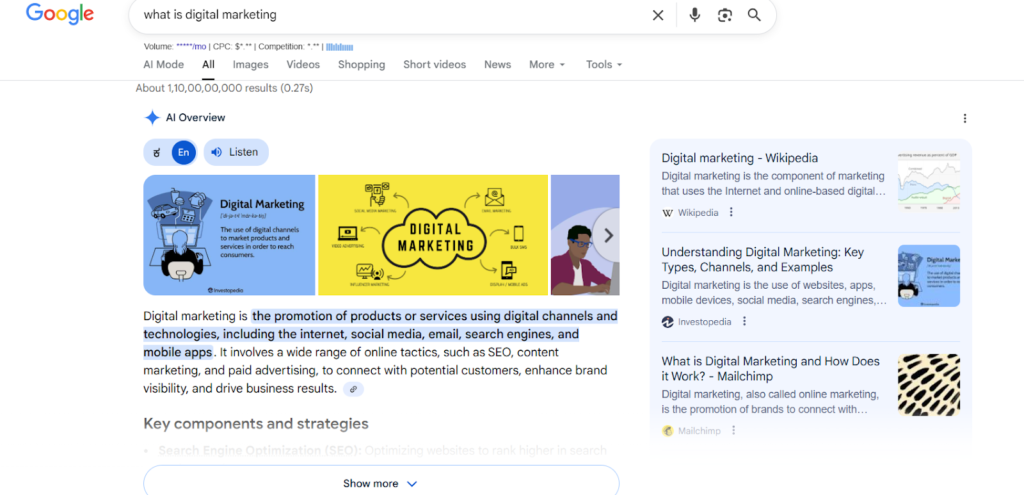
Bing AI, ChatGPT Search, and Perplexity follow a similar pattern, which makes the experience feel more like chatting with a well-read assistant than browsing a page of results. This new format affects how people interact with search. Users get direct answers without scrolling or comparing links. It feels quick and convenient, but it also means traditional SEO signals don’t tell the full story anymore. A ranking drop may simply mean the user never needed to click, not that your content lost relevance. And impressions can’t show whether your brand appeared inside an AI answer.
That’s why older dashboards fall short. They were built for metrics shaped by clicks and positions, not by AI-generated responses. Modern SEO dashboards need new KPIs that capture how often content appears inside snapshots, how frequently it’s cited, and whether it’s included in conversational replies across platforms.
Rankings still matter, but they’re only part of the picture now. To understand visibility in an AI-first search world, teams need dashboards that track what’s happening inside those answer layers.
What Metrics Define “AI Search Performance”?
As AI-driven search becomes a regular part of how people look for information, SEO teams need metrics that reveal what’s happening inside these new answer layers. Traditional numbers like rankings and clicks can’t capture the full picture anymore. AI search pulls, blends, and presents information in ways that don’t always require a user to visit a site, so we need KPIs that reflect that reality.

AI Snapshot visibility
This shows how often your content appears inside AI-generated snapshots. Since these snapshots pull from multiple URLs, this metric helps you understand whether your page is part of the answer set.
AI response inclusion rate
This tracks the percentage of queries where your content is used to shape an AI response. Even if your site isn’t cited, it may still influence the answer, so visibility alone isn’t enough.
Citation frequency
This measures how often the AI displays your link as a source. It’s a strong indicator of authority, especially when citations change dynamically as the AI refines its answer.
Brand mentions in AI answers.
Sometimes the AI references your brand directly without linking to you. Tracking these mentions helps you see how visible your name is within these conversational experiences.
Conversational intent coverage
AI search often responds to natural, long-form questions. This metric tells you how well your content satisfies those conversational queries that weren’t always part of classic keyword research.
Zero-click behaviour tracking
With more searches ending on the results page, this metric helps you understand where users stop interacting and whether AI summaries answer their questions before a click.
Traffic from AI-optimized pages
Even with zero-click behaviour rising, some pages still gain traffic when aligned with AI summaries. Tracking this helps you identify what types of content continue to attract visits.
Together, these KPIs build a clearer view of your true performance in the AI-first search landscape.
Now, let us move to the practical aspects: understanding how to develop SEO dashboards AI, and how it helps with SERP reporting.
Step-by-Step Framework to Build an AI SEO Dashboard
Below is a clear, practical framework you can follow to build SEO dashboards AI teams actually use. Let us start:
Mapping objectives
Start with outcomes, not metrics. Ask what you want the dashboard to prove or improve. Short list possible objectives: increase organic conversions, improve answer-box visibility, reduce bounce on AI-fed pages, or boost branded mentions in AI replies. Pick two or three priorities only. Too many goals dilute focus.
Choosing metrics
Choose KPIs that map directly to your objectives. Keep the set lean. A focused dashboard surfaces insight fast. Useful metrics include AI snapshot visibility, citation frequency, conversational intent coverage, organic traffic, engagement metrics, and SERP reporting for traditional context. Make sure each KPI answers a question; if it does not, drop it.
Collecting data
Figure out where each metric will come from. Some data lives in Google Search Console and Google Analytics. Other signals need scraping, or API pulls from Perplexity, Bing, or platform-specific endpoints.

Plan a data schema. Tag pages by intent and topic. Timestamp every record. This makes historical trend work easier and keeps your data reliable.
Choosing tools
Pick a visualization layer that fits your team. Here are common choices:
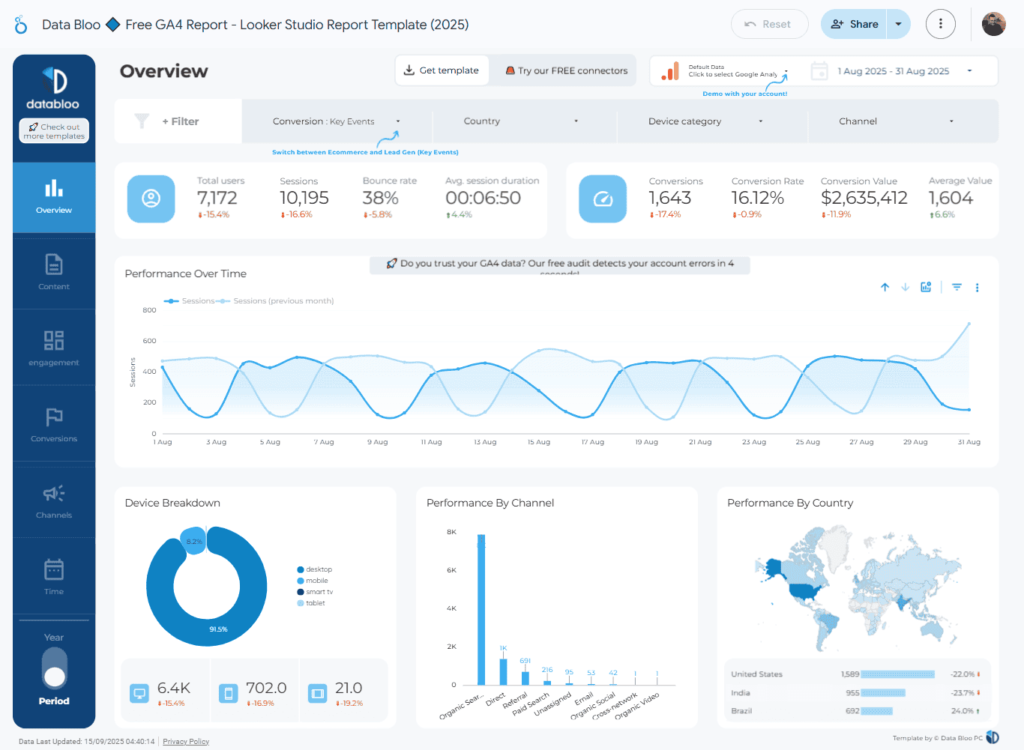
- Looker Studio for fast, flexible dashboards and easy Google integrations.
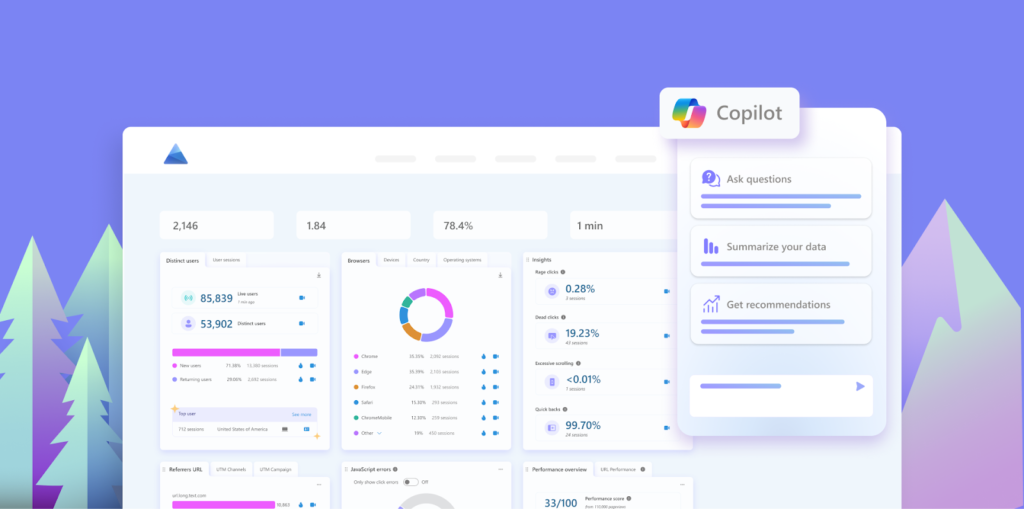
- Power BI for advanced transformations and internal sharing inside Microsoft ecosystems.
- Tableau for rich visuals and large datasets.
- Use a tool that matches your skillset and budget. You can combine them with a lightweight ETL if needed.
Creating individual dashboard widgets
Think of widgets as small stories. Each one should answer one question. Keep labels simple and add short tooltips for nuance.
Visibility widgets
Show how often your pages appear inside AI snapshots and answer boxes. Combine a daily trend line with a heatmap by topic. Add a percent change metric for the last 7 and 30 days so the viewer sees momentum immediately.
Citation widgets
Display citation frequency by domain and page. Use a top-10 table for the most cited URLs and a small timeline showing citation spikes. If possible, surface the exact quote or excerpt the AI used. That tells you what content the AI prefers.
Traffic trend widgets
Plot organic traffic alongside zero-click rate. Use a stacked area chart to compare sessions from AI-optimized pages versus traditional pages. Add engagement metrics such as time on page and bounce rate to judge visit quality.
Keyword clusters
Group keywords into clusters by intent. Show cluster-level performance instead of individual keywords. A cluster widget should include total impressions, clicks, AI-inclusion rate, and conversion rate. This reduces noise and highlights content opportunities.
Integrating AI search tracking scripts
To capture AI-layer visibility, you will sometimes need custom instrumentation. Inject lightweight tracking scripts into pages that tag content fragments, structured data, and canonical signals.
These scripts send back identifiers when your content is crawled or picked by an AI system that provides an API callback. If you cannot get callbacks, schedule regular crawls against AI result pages and parse snapshots for citations and mentions. Always respect platform terms and robot rules.
Setting up automated reporting
Automate what you can. Schedule daily or weekly data pulls, then transform and store them in a central warehouse or Google Sheets. Use your dashboard tool to refresh visuals automatically.
Add a short executive summary block that surfaces only the biggest wins and risks. Send a compact PDF or email snapshot to stakeholders each week with three actions they can take based on the data.
Practical tips and guardrails
Keep the dashboard light on. Human reviewers should scan it in under five minutes. Use color and layout consistently. Establish ownership and a review cadence. Finally, document data definitions so everyone interprets the numbers the same way.
How Do SEO Dashboards AI Help Companies?
AI-driven search has changed how people discover brands, and companies now need clearer visibility into what happens inside these evolving results. SEO dashboards built for AI search do more than organize numbers. They help teams understand how often their content appears in AI answers, where visibility drops, and what drives engagement.
When done well, these dashboards become a daily guide for decisions, not just a report. Here’s how they help businesses in practical, measurable ways.
Improved Decision Making With Real-Time Insights
Companies no longer wait for monthly reports to understand performance. An AI-focused dashboard shows visibility trends as they happen. Maybe a page starts appearing inside AI snapshots. Maybe citations dip on a critical query. Seeing this in real time gives teams the chance to act early instead of uncovering problems weeks later. Decisions feel quicker, clearer, and far more grounded in live data.
Clarity on AI Snapshot Presence
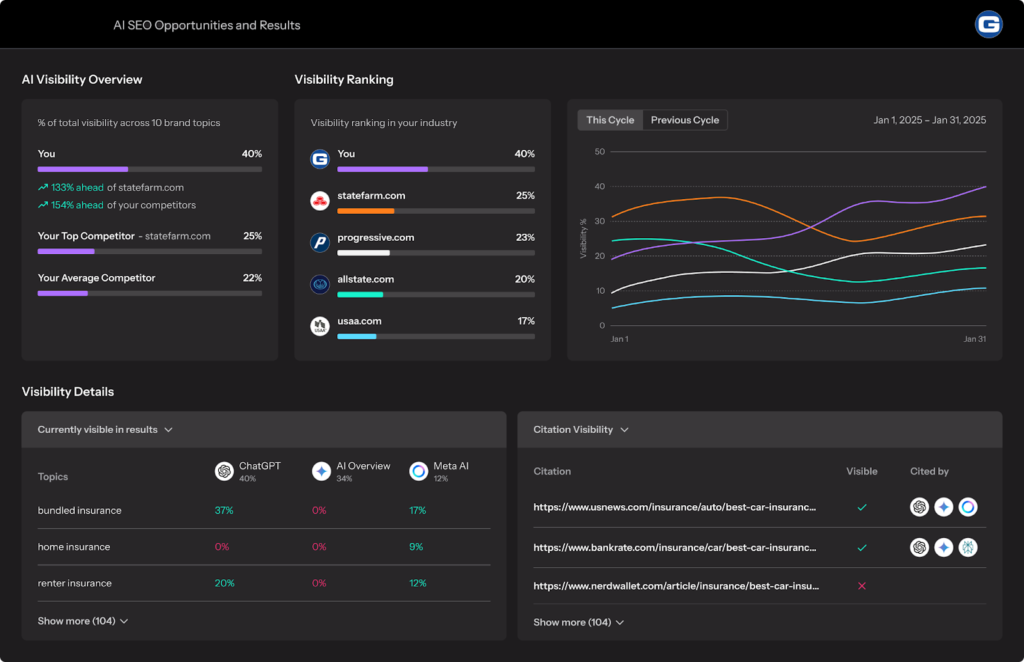
Most teams have no idea how often they show up in AI-led answers. With a dashboard tailored for that, companies can finally see which pages appear in snapshots, how often they’re cited, and where competitors hold stronger ground. It helps spot opportunities, too. If one topic cluster keeps getting picked by AI, that tells you what content to expand or update next.
Better Understanding of Audience Behaviour
Traditional metrics don’t explain why users stop clicking. With engagement metrics layered into an AI dashboard, businesses see how behaviour shifts when AI summaries dominate a search journey. Drops in traffic aren’t always failures. Sometimes the AI is using your content even when users don’t visit. Seeing both sides of the story helps teams refine strategy without panic or guesswork.
Smarter Content Planning and Prioritisation
AI dashboards highlight which content is gaining visibility inside answer layers and which ones need help. If certain keywords consistently trigger AI responses, you know exactly where to create deeper guides, restructure pages, or add supporting articles. It turns content planning from a guessing game into a simple “focus here first” system.
Stronger Competitive Awareness
AI answers often pull from multiple brands at once. Dashboards built for AI search show where competitors appear more frequently, which pages they dominate, and how often they get cited. This lets companies benchmark their visibility directly against rivals. Instead of relying on broad assumptions, decisions are made with specific data: who shows up, where, and how often.
Streamlined Reporting for Teams and Stakeholders
A structured AI SEO dashboard reduces the chaos of scattered reports. Everything sits in one place: SERP reporting, visibility trends, citation rates, keyword clusters, and traffic changes. Teams can present a simple snapshot to leadership without drowning them in spreadsheets. Automated summaries also save hours every month, freeing teams to focus on strategy instead of assembling data.
Best Practices for SEO Reporting Dashboards
A strong SEO dashboard makes it easier to see what’s working, what’s slipping, and where your next effort should go. But to build one that actually helps, you need the right approach. Many dashboards look impressive at first glance, but feel confusing or overwhelming the moment someone tries to use them. The goal is clarity, not clutter.
Below are practical best practices that help you create an SEO reporting dashboard that feels useful every time you open it.
Focus on Data That Drives Action
A dashboard shouldn’t be a storage space for every metric you’ve ever collected. It’s a tool for decisions. Highlight only the numbers that help you act. If rankings are your priority, show ranking movement instead of a giant list of keywords. If conversions matter more, surface those stats front and center. When every metric ties directly to a decision, the dashboard becomes faster to read and easier to trust.
Use Visuals That Speak for Themselves
Charts should make things clearer, not harder. Pick visuals that match the type of data you’re showing. A bar chart works well when comparing keyword groups. A pie chart makes sense for traffic sources. A simple line graph is perfect for trend lines across months. The trick is to keep each visual clean and readable. If a chart requires more than a second or two to understand, it may be too complex.
Tailor the Dashboard for Different Viewers
Not everyone who opens your dashboard cares about the same details. A client wants to see growth, conversions, and clear movement. A content team wants insight into high-potential topics. A technical SEO team may focus on indexing issues or site speed. Your dashboard should shift based on who’s reading it. When each viewer sees the metrics that matter to them, meetings become smoother and outcomes sharper.
Update and Review the Dashboard Often
SEO changes constantly. A metric that mattered six months ago may not matter today. That’s why dashboards need regular check-ins. Review them monthly or whenever priorities shift. Remove metrics that no longer help and add ones that match new goals. A dashboard that evolves stays useful. One that stays static turns into a confusing archive of old numbers.
Track Competitor Performance Too
Your site doesn’t exist in isolation. Competitors influence your visibility more often than you think. Include widgets that show competitor keyword rankings, backlinks, or top-performing content. Even a simple comparison chart can reveal where you’re losing ground or where you can leap ahead. Seeing your performance next to others offers context you simply can’t get from your own numbers alone.

Keep the Layout Clean and Easy to Scan
A good dashboard feels calm. Not crowded. Use spacing, grouping, and clear labels. Place high-impact metrics at the top, supporting details below, and optional insights at the bottom. This helps anyone scan the page in seconds. When people enjoy reading your dashboard, they’re more likely to use it, and that’s the ultimate goal.
Final Words
AI is reshaping search faster than most teams can keep up, and SEO dashboards AI built for this new world make the shift easier to navigate. When you track AI snapshot visibility, citations, and answer-layer performance and not just ranking, you see the full picture of how users discover your brand. It turns your dashboard into a practical guide instead of a static report.
This is where Rankfast steps in. We help brands understand how often they appear in AI Overviews and other emerging platforms. Our approach highlights missed opportunities, strengthens content that AI prefers, and improves your chances of being featured in those high-impact summaries. If you want your brand to stay visible in an AI-first search environment, Rankfast gives you the tools and strategy to move ahead with confidence.
FAQs
1. What is an AI SEO dashboard?
An AI SEO dashboard tracks how your content appears inside AI-driven search results, such as snapshots, summaries, and conversational answers. It combines traditional metrics with AI-specific KPIs so you can understand visibility, citations, and traffic patterns beyond standard rankings.
2. Why do AI search metrics matter?
AI summaries reduce clicks, so traditional metrics alone don’t show true visibility. AI search metrics help you see when your content appears in snapshots or influences answers, even without visits. This gives a clearer view of brand presence and content impact.
3. How often should an AI SEO dashboard be updated?
Most teams review their dashboards weekly. AI search shifts quickly, so frequent updates help you spot changes in snapshot visibility, citations, and engagement trends. If you work in a fast-moving niche, daily refreshes offer even better insight.
4. Can SEO dashboards AI replace traditional SEO reporting?
Not entirely. They complement each other. Traditional metrics still show traffic, conversions, and ranking health. SEO dashboards AI add another layer by revealing how your content performs inside AI answers, giving you a fuller, more accurate picture of search performance.
5. How does Rankfast support AI search optimization?
Rankfast tracks your presence across AI Overviews, Perplexity, Bing AI, and other platforms. We identify missed citation opportunities, strengthen high-value content, and help brands improve visibility inside AI-generated answers. This ensures stronger performance as search becomes more AI-driven.